Loss of vitality in German forests by municipalities
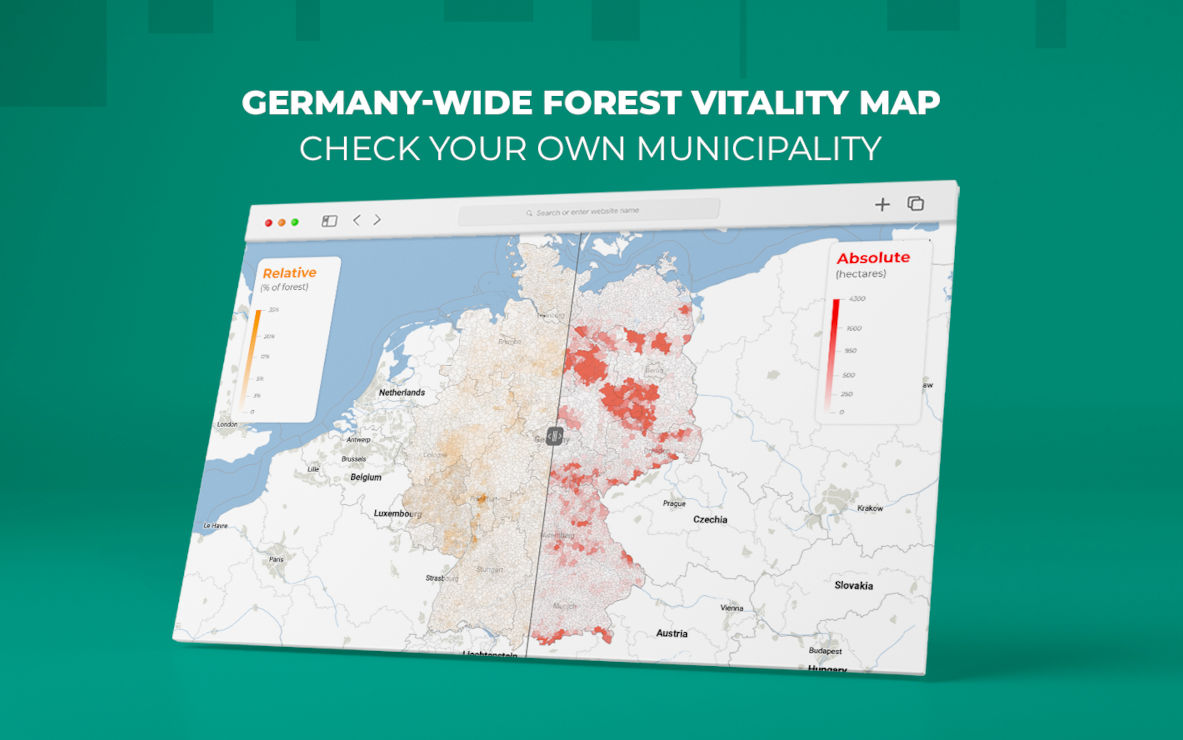
We have taken a close look at the loss of vitality in German forests and prepared the results compactly and clearly in the form of an interactive map – down to municipality level.
You can find the map here. It marks the first instance of nationwide forest health data by municipalities being made accessible. The map provides with a comprehensive health assessment for German forests and crucial data on the extent of vitality decline. WoodsApp, our first app tailored for the forestry and launched to German market this year, is at your service if you want to dive deeper into the matter, and to take action if needed.

While the map is open, just search for your municipality and click on it. You will then see two values:
- The affected forest area with loss of vitality in the selected municipality in hectares (ha) in red and
- the relative share of the forest with health stress in percent (%) in orange
In our study, we utilized satellite data from July 15, 2023. The interactive map succinctly presents the conditions during the summer of 2023. This map serves as a snapshot, reflecting the situation up to the provided cut-off date, and unlike the constantly updated WoodsApp vitality map, it is not subject to continuous updates.
Below, we aim to provide a comprehensive explanation of the methodology employed in the creation of our vitality map.
Methodology for analyzing vitality data
To begin, we will explain the methodology in use when we analyze our vitality data, which undergoes continuous updates and is accessible to all WoodsApp users. This map serves as the foundation for the the Germany-wide vitality map by municipalities.
Every two days, the latest Sentinel 2 images are uploaded from ESA’s server to our infrastructure.
The images are then analysed for cloudiness to select the cloud-free images. Only these are finally used for the calculation of the vitality signal. Read more about the satellite data on land use, as explained in our previous post
Sentinel 2 captures images across 13 different color ranges, including those visible to the human eye, as well as the invisible infrared spectrum. The infrared range holds particular significance in our analysis of vitality loss, as it effectively highlights the photosynthetic activity of trees.
Drought-stressed trees exhibit distinctive features in the infrared spectrum, forming the core of our vitality service. Moreover, insights from ground observations, along with feedback from foresters and experts across Germany and Austria, are integrated into our model.
Through the assessment of various indices for each 10m by 10m pixel, we generate a map that highlights regions where tree health is potentially compromised. This information is then merged with high-resolution satellite and aerial imagery and made accessible on our WoodsApp platform. Throughout the vegetation period, we aim to update this map approximately every two weeks, contingent upon the availability of cloud-free satellite data.

Methodology for analyzing the vitality map by municipalities
As said, in the context of this study, the vitality map described above was used as a basis.
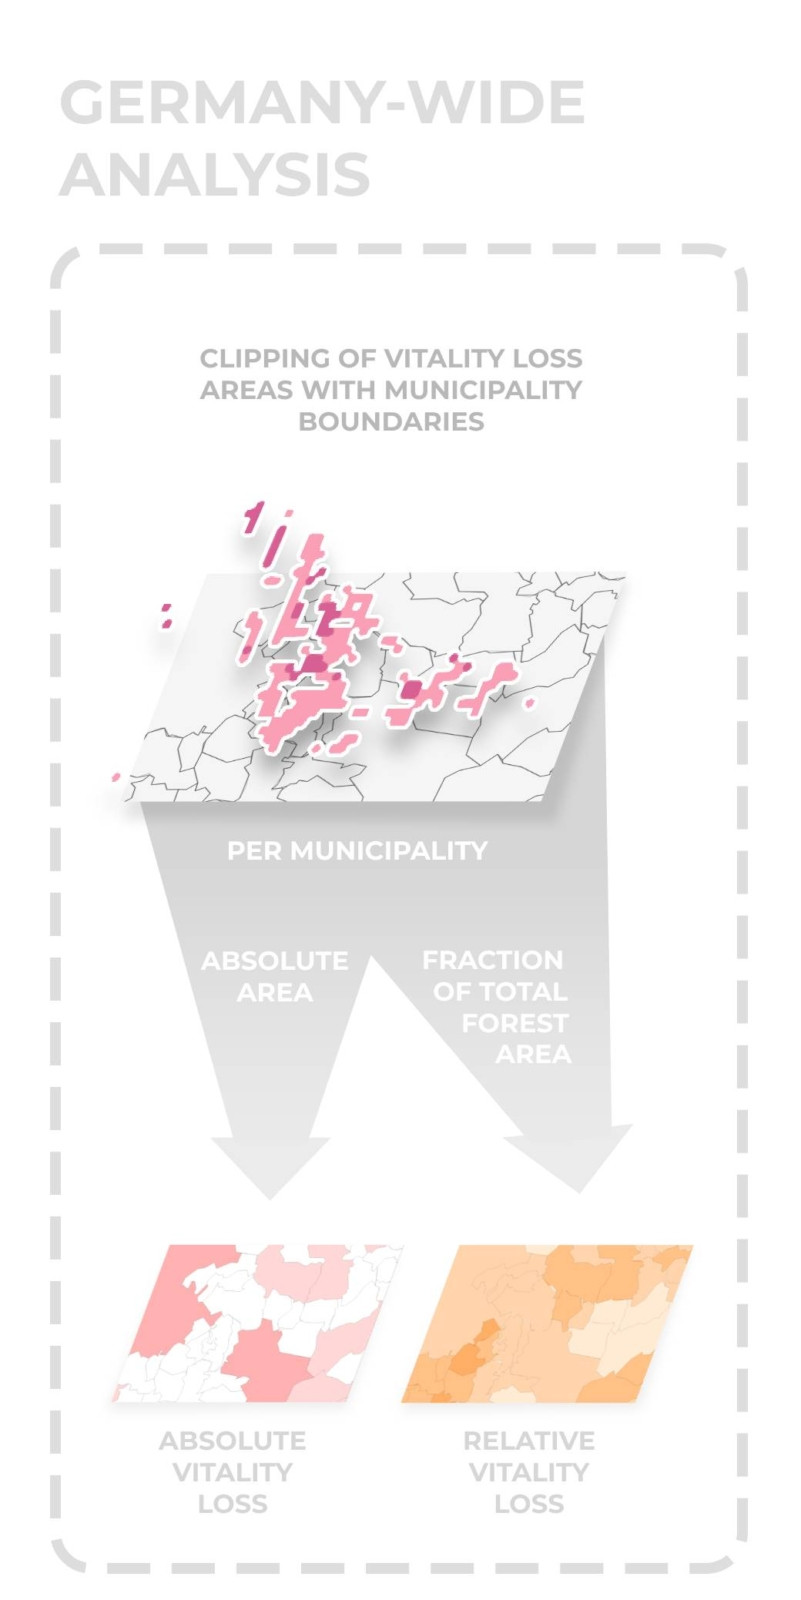
For this purpose, the latest available vitality data was summarised at municipality level throughout Germany up to the cut-off date of 15 July 2023. In individual small areas where no current vitality data from 2023 was yet available, the most recent data from 2022 was used.
The sum of the affected forest area in hectares was calculated for each municipality, as well as the percentage share of the total forest area.

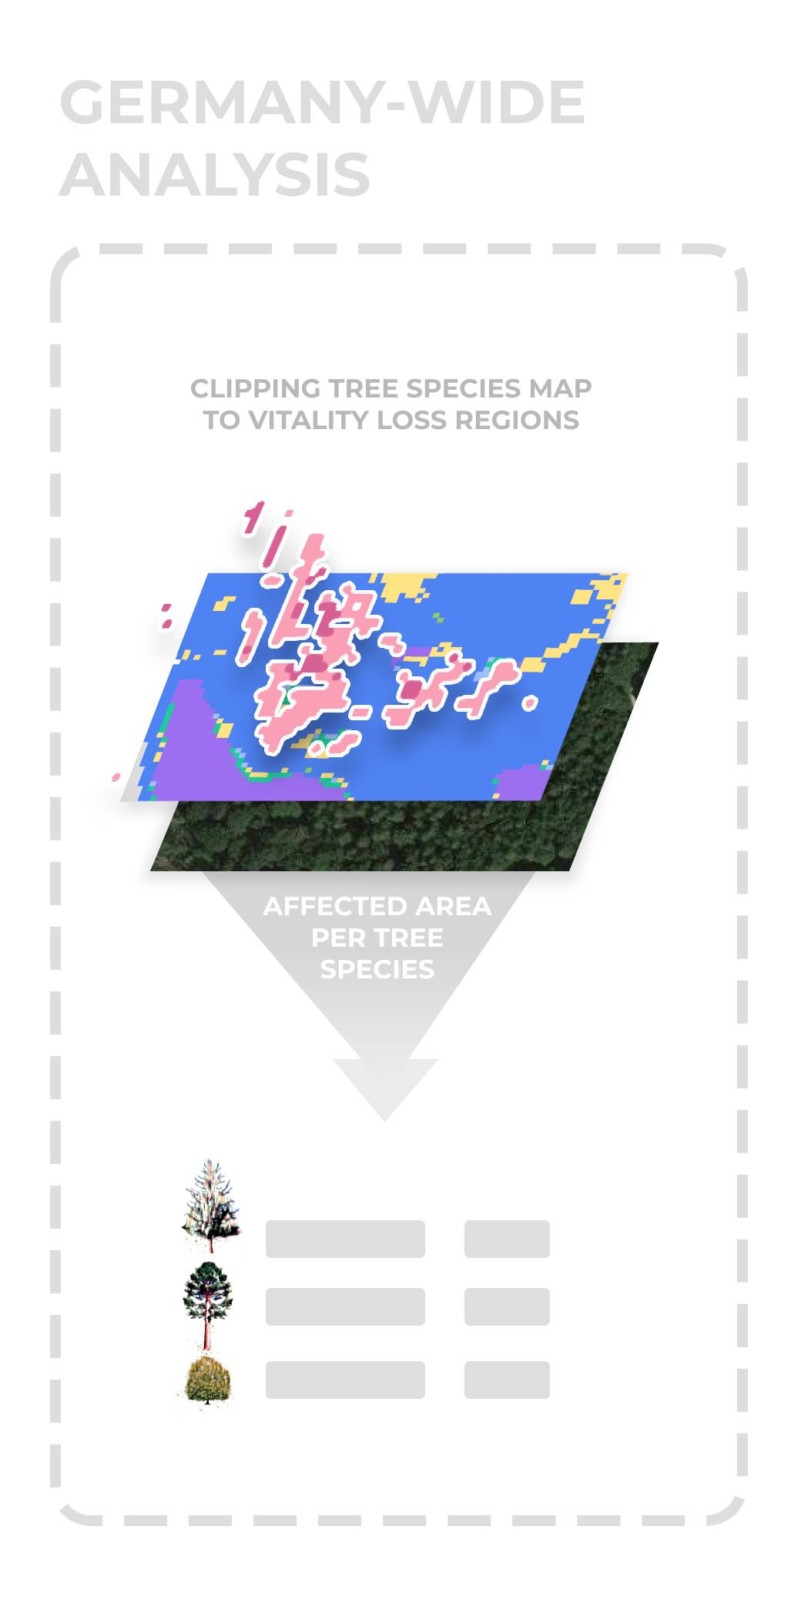
In addition, the areas with loss of vitality were overlaid with a Germany-wide map of tree species (Blickensdörfer et al. 2022). This made it possible to identify the most affected tree species throughout Germany. For each treespecies, the affected area in hectares, as well as the proportion of affected trees, was calculated.

A quick look at the results
As part of the study, a ranking of the most affected municipalities was compiled – both in terms of the relative share of forest area (%) and the absolute area affected (ha).
| Municipality | Affected share in % | Affected surface (ha) | |
|---|---|---|---|
| Schilda (Brandenburg) | 35,8% | 142 ha | |
| Röderland (Brandenburg) | 32,3% | 189 ha | |
| Warmensteinacher Forst-Nord (Bayern) | 31,7% | 68 ha | |
| Bad Bodenteich (Niedersachsen) | 27,8% | 524 ha | |
| Ranking of most affected municipalities by loss of vitality in Germany | |||
Schilda in Brandenburg is the most affected municipality in Germany in percentage terms: more than one third of the forest area (35.8%) is affected by severe loss of vitality. This is followed by Röderland (Brandenburg) with 32.%, Warmensteinacher Forst-Nord (Bavaria) with 31.7% and Bad Bodenteich (Lower Saxony) with 27.8%.
| Municipality | Affected surface (ha) | Affected share in % | |
|---|---|---|---|
| Gardelegen (Sachsen-Anhalt) | 4 308 ha | 18,1% | |
| Nuthe-Urstromtal (Brandenburg) | 1 778 ha | 9,9% | |
| Doberlug-Kirchhain (Brandenburg) | 1 526 ha | 22,4% | |
| Möckern (Sachsen-Anhalt) | 1 333 ha | 6,9% | |
| Ranking of the municipalities in Germany most affected by loss of vitality in terms of area | |||
Gardelegen in Saxony-Anhalt tops the table of the most affected municipalities in terms of area with 4 308 hectares. Gardelegen is the third largest municipality in Germany after Berlin and Hamburg, and since there are also many forest areas there, this result is not surprising. Nuthe-Urstromtal and Doberlug-Kirchhain in Brandenburg and Möckern in Saxony-Anhalt follow at some distance.
What it comes to states, according to the present study, Saxony-Anhalt tops the list at the federal state level; a total of 5.9% of the forests being affected by loss of vitality. It is followed by Saxony, Rhineland-Palatinate, Thuringia and North Rhine-Westphalia.
In terms of area, the picture is as follows: Bavaria is the most affected in terms of area, with approx. 81,000 ha. It is followed by Rhineland-Palatinate, Lower Saxony, Brandenburg and North Rhine-Westphalia.
Which tree species are most affected?
For forest managers, the list of vitality losses by tree species is also likely to be highly relevant – after all, it raises the familiar question of climate-adapted forest conversion, which is becoming an increasingly urgent task in view of climate change.
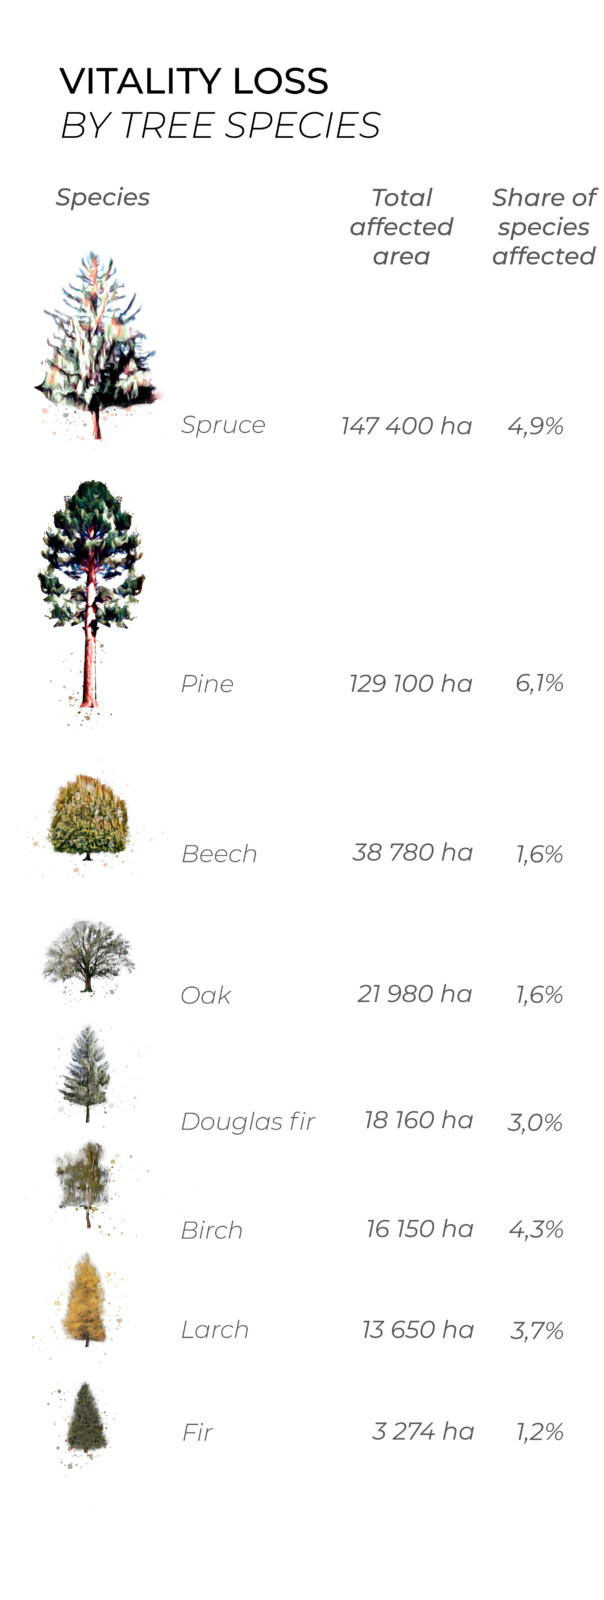
The study identified the following tree species as being most affected: Pine (6,1%) Spruce (4,9%) Birch (4,3%) Larch (3,7%) Douglas fir (3,0%).
The percentage values indicate the proportion affected by loss of vitality within the respective tree species. This means that a significant loss of vitality was detected in 6.1% of all pine trees, in 4.9% of all spruce trees, etc.
From the list of species examined, the alder and the fir are proportionally the least affected.

Challenges and limitations in current methodology
Although the methodology we use is highly accurate, there are also misinterpretations, e.g. due to insufficient filtering of cloud cover or other interfering factors in the satellite images.
It also presents challenges when damage to trees is not visible from above. For example, acute bark beetle infections of the second or third generation can already cause the bark of trees to flake off while the crown still appears green and vital. Furthermore, in sparse forests, dried out undergrowth can produce vitality signals, even though the isolated standing trees are healthy.
Nevertheless – or precisely because of this – we remain committed to work on a steady improvement of our vitality services to provide all stakeholders with reliable satellite-based data for informed land property management decisions.


